Probably the most common kind of diagram in business & engineering. The basic behavioral chart.
flowchart LR
	a(Write a concept down) --> b(Write down something related) --> c(Draw lines between things)
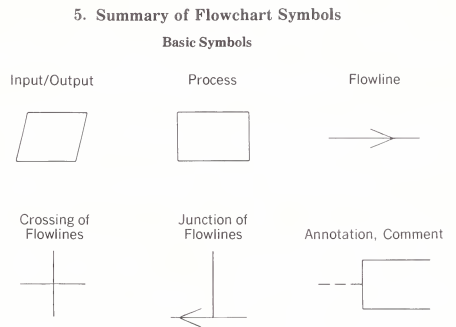
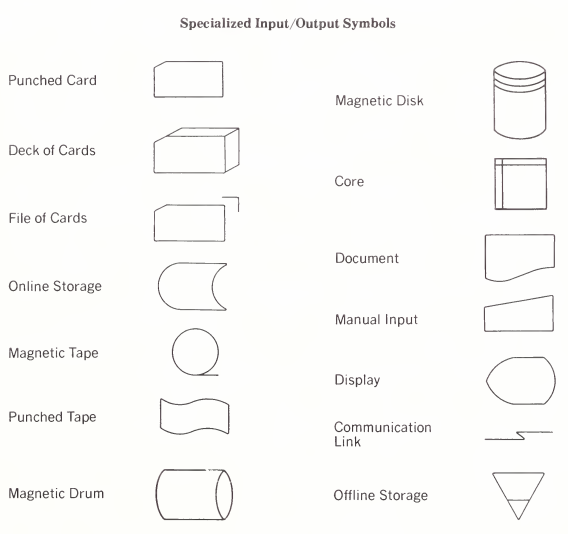
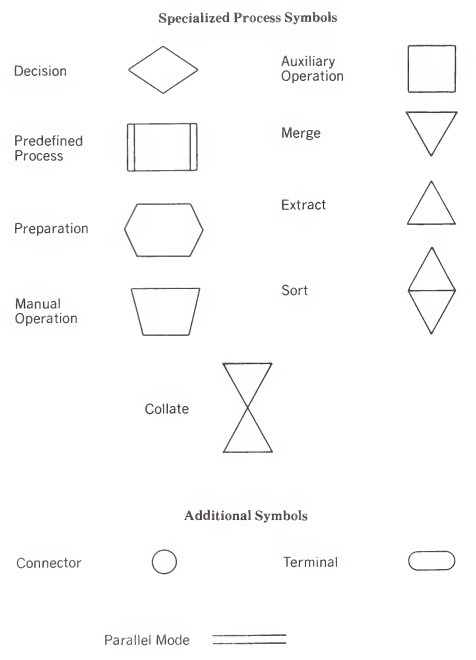
Flow charts are everywhere. Flow charts are in several Six Sigma tools, Business Process Modeling Notation (BPMN ), Unified Modeling Language (UML) and SysML each have several things that could be broadly categorized as a “flow chart”. Arguably all OPM diagrams have the potential to be flowcharts, as do half of the constructs in IDEF (IDEF). The closest thing to the “one true standard” for Flow Charts is what was jointly adopted by the American National Standards Institute (ANSI) and the ISO, including shape definitions for useful things like “process”, “input/output”, “decisions”, and much less useful things like “magnetic tape”, and “collation”.
-
The other, more specialized stuff…
They are useful for explaining how processes work. They’re typically fairly intuitive - easy to create and easy to understand. You can even create them using code with tools like Mermaid or PlantUML.