Scheduling diagrams with dependent events shown as cascading rectangles on a linear schedule.
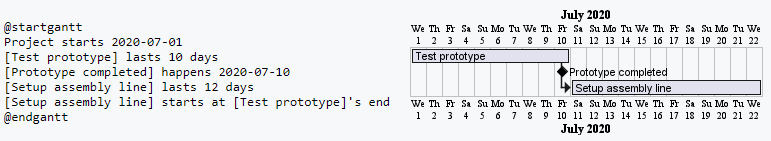
Gantt Charts are a form of scheduling diagram in which activities are represented in rectangles, placed along a common timeline, often including relationship constraints like “finish/begin” constraints. Common tools for creating Gantt charts include things like Microsoft Project - or even Notion’s Timeline database view. But you can also draw them with Diagrams as Code tools.
Examples
Mermaid
gantt
    title Making a Snack
    dateFormat  YYYY-MM-DD
    section Section
    Put toast in toaster   :a1, 2014-01-01, 30d
    Toaster Toasts     :after a1  , 20d
    Butter bread        : 10d
    section Another
    Pour drinks      :2014-01-12  , 12d
    Serve Drinks      : 24d
PlantUML